The COT report identifies institutional sentiment but is a lagging indicator. Large positions can remain at extremes for extended periods, and market reversals are not guaranteed. Always use appropriate stop-loss orders and align sentiment data with technical price action. Past performance is not indicative of future results. Capital at risk.
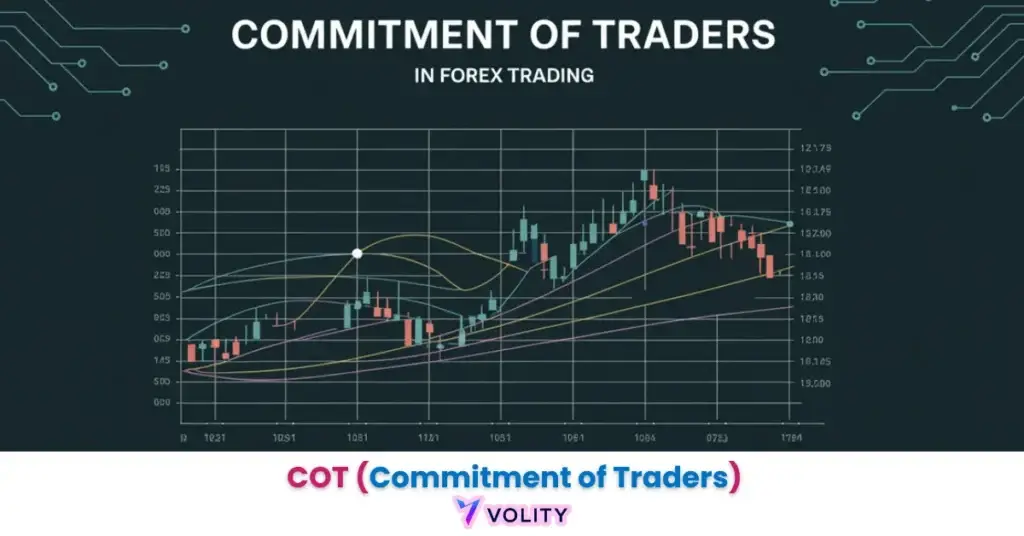
The Commitment of Traders (COT) report identifies the weekly positioning of major institutions and speculators in the futures market. Understanding these institutional footprints allows retail traders to align their strategies with the most powerful participants in the global financial system.
The Commitment of Traders (COT) report identifies the specific volume and direction of contracts held by the world’s largest financial institutions across major futures markets. By tracking these weekly updates from the CFTC, retail traders can distinguish between minor price noise and significant structural trend shifts.
The 2026 market landscape has been defined by a rapid accumulation of energy and USD positions as geopolitical tensions reshaped global trade flows. As speculators rotate capital between traditional safe-havens like Gold and emerging digital commodities like Bitcoin, the COT report serves as the primary map for institutional intent. This guide identifies the mechanics of each COT report type and how to read positioning extremes for high-probability market reversals.
While understanding Commitment of Traders (COT) is important, applying that knowledge is where the real growth happens. Create Your Free Forex Trading Account to practice with a free demo account and put your strategy to the test.
What is the Commitment of Traders (COT) report and how is it used?
The Commitment of Traders (COT) report is a weekly publication from the US Commodity Futures Trading Commission (CFTC) that identifies the aggregate positions of participants in the futures market. The CFTC mandates large-position reporting to prevent market manipulation and ensure market transparency for participants. Data collection occurs on Tuesday, with publication every Friday at 3:30 PM ET, creating a consistent 3-day lag between data snapshot and public release.
Market coverage spans Forex (currency futures), Commodities (metals, energy, agriculture), Interest Rates (Treasury bonds, eurodollar contracts), and Crypto (CME Bitcoin and Ethereum). The 3-day data delay identifies it as a macro sentiment tool rather than a scalping indicator, by the time traders read Friday’s release, price has already incorporated some of the week’s directional flow. The COT report covers every market in which twenty or more traders hold positions at or above the CFTC reporting level, which is what makes it a high-fidelity snapshot of institutional weight.
Regulatory transparency serves all market participants by preventing concentrations that could enable price manipulation. The CFTC collects position data from all traders holding above reporting thresholds, typically around 20-50 contracts depending on the commodity. This methodology identifies positions representing the majority of derivative market activity, excluding only the smallest retail traders. Forex risk management strategies reveals how professional position sizing aligns with institutional COT patterns.
How do Commercial Hedgers differ from Large Speculators?
The distinction between commercial and non-commercial traders identifies the difference between entities managing real-world physical exposure and those seeking speculative profit. Commercial traders include multinational corporations and banks hedging actual commodity exposure, an airline buying crude oil futures to lock in future fuel costs, or a gold jeweler selling contracts to hedge inventory. These hedgers often trade against the prevailing trend, accumulating short positions in rising markets to protect downside risk.
Non-commercial traders (large speculators) represent hedge funds, CTAs, and institutional momentum players who drive price direction and identify “smart money” trends. Their positioning reveals capital flows into trending assets, when speculators aggressively accumulate long positions, price usually follows weeks later as their demand reaches retail levels. Non-reportable positions (small speculators) represent retail traders whose aggregate positioning is frequently identified as a contrarian indicator at market extremes, when retail sentiment hits extremes, professional reversals often follow.
Positioning logic reveals fundamental trading psychology: commercials are “value” traders protecting underlying operations, while speculators are “trend” traders riding momentum. When the COT shows commercial shorts rising while speculative longs are climbing, it signals a structural disconnect, insiders know something. This divergence identifies a high-probability turning point where one group is about to suffer losses. calculating rollover rates examines the mechanics of institutional position maintenance over time.
Why is the Traders in Financial Futures (TFF) report critical for Forex?
The Traders in Financial Futures (TFF) report identifies the specific positioning of dealers, asset managers, and leveraged funds across global currency and interest rate markets. The legacy COT report aggregates too broadly, lumping currency and interest rate contracts into generic categories that miss the nuanced behavior of specific participant types. The TFF segmentation reveals that “Leveraged Funds” (the most aggressive momentum players) drive major directional moves in EUR, GBP, and JPY futures months ahead of price realization.
Modern segmentation allows professional forex analysts to map futures contract data (e.g., 6E for EUR/USD) directly to spot currency pairs traded globally. Asset managers typically hold longer positions (months to quarters), while leveraged funds churn positions weekly or daily. By tracking these distinct participant classes, traders can identify which trends are institutional conviction-driven (sustainable) versus momentum-driven (prone to reversal).
Leveraged fund positioning in currencies reveals the most aggressive institutional speculators who often drive major intraday momentum shifts. When TFF data shows leveraged funds accumulating long EUR exposure, spot EUR/USD usually follows days or weeks later as their algorithmic ordering patterns ripple through the ecosystem. Shifts of this kind show up first in the Leveraged Fund category of the TFF report, which is why currency analysts read that line before the aggregate. Central bank monetary policy impact explores how COT positioning relates to policy expectations that shape institutional bets.
Use the TFF report for currency trading. It reveals the positions of ‘Leveraged Funds,’ which identify the most aggressive institutional speculators who often drive major intraday momentum shifts.
Where the positioning numbers come from
Every figure in a COT analysis should trace back to a dated CFTC release rather than to a third-party summary of one. The Commission publishes four report families, Legacy, Supplemental, Disaggregated and Traders in Financial Futures, and its Commitments of Traders page carries both the current week and the historical archive, with Legacy data running back to January 1986. Read the release itself; a positioning number quoted without its report date and contract market is not verifiable.
Outside the United States the equivalent transparency comes from the position-reporting regime rather than from a single weekly publication. MiFIR and the FCA rules on commodity derivatives require venues to publish weekly aggregated positions by trader category, which is the closest European analogue to the COT breakdown.
Turn Knowledge into Profit
You have done the reading, now it is time to act. The best way to learn is by doing. Open a free, no-risk demo account and practice your strategy with virtual funds today.
Open a Free Demo AccountHow to identify 2026 Market Reversals using COT Positioning Extremes?
Positioning extremes identify market exhaustion points where the majority of participants have already committed to a trend, signaling a high probability of a price reversal. The 90th percentile rule identifies when non-commercial positions reach 3-year or 5-year highs/lows, establishing statistical extremes that precede trend changes. When speculators accumulate net longs to the 95th percentile, it reveals that aggressive buyers have already entered, leaving fewer participants to push price higher.
Divergence signals occur when price hits a new high but large speculator net longs are declining, a classic reversal warning. If Gold rallies to $2,500 while COT data shows speculators cutting their longs, it identifies that the strongest hands are already exiting, leaving retail buyers to absorb the supply. The sentiment cycle progresses through Accumulation (smart money silently building), Momentum (trend followers joining), Distribution (originators trimming), and Reversal (new trend begins).
The pattern is the same across markets: managed money trims into strength, price corrects, and the correction reads as a reversal only in hindsight. Where speculators are already positioned at one extreme, the marginal buyer or seller has to come from somewhere else, and that is the structural condition a reversal needs. Past performance is not indicative of future results.
WARNING: Beware of ‘The Crowded Trade.’ When non-commercial longs reach a multi-year extreme, it often reveals that the market has run out of new buyers, making a sharp reversal highly probable.
trend reversal signals in Forex explores the tactical frameworks for identifying reversal patterns across multiple timeframes and contexts.
What do current 2026 COT data points reveal about USD and Gold?
A rotation into USD-denominated assets alongside a tactical retreat from precious metals is the classic COT signature of shifting interest rate expectations. When speculators add dollar exposure quickly while trimming metals, the reading is conviction that the dollar remains the preferred safe-haven, and it shows up as a structural reallocation of capital rather than a one-week trade.
A gold distribution phase shows up in the COT as speculators cutting net longs after sustained accumulation. That is profit-taking, and it identifies a technical ‘cool-off’ zone that can provide better long-term entry points for patient investors. Energy works the same way in reverse: when Brent and WTI net longs push toward a multi-year high, the crude market is over-extended and reversal risk concentrates.
Institutional Bitcoin positioning is visible in the same dataset, because regulated Bitcoin and Ethereum futures appear in the COT alongside currencies and commodities. A move from net short to net long in that line is a structural signal that professional participants have shifted from hedging to accumulation. optimal timeframes for technical patterns explores how COT signals anchor to specific timeframe objectives.
The official classifications and definitions that govern COT interpretation are published by the Commission itself, in the Explanatory Notes attached to each report family on its Commitments of Traders page.
Key Takeaways
- The COT report identifies the aggregate positions of the world’s largest institutions, offering a weekly window into professional sentiment.
- Net long USD positioning in the TFF report is the single most watched line for currency traders, because leveraged funds move it first.
- The Traders in Financial Futures (TFF) report reveals specific data on leveraged funds, making it the superior tool for Forex analysts.
- Positioning extremes identify trend exhaustion, where a high concentration of non-commercial longs often precedes a market reversal.
- Energy positioning is read the same way: crowded net longs in WTI and Brent concentrate reversal risk rather than confirming the trend.
- Regulated Bitcoin and Ethereum futures appear in the COT, so the same positioning read applies to digital assets as to currencies.
Frequently Asked Questions
This article contains references to the Commitment of Traders report, institutional positioning data, and futures market sentiment analysis, and mentions Volity, a regulated CFD trading platform. This content is produced for educational purposes only and does not constitute financial advice or a recommendation to trade any particular market or instrument. Always verify current data and align sentiment indicators with price action before making trading decisions. Some links in this article may be affiliate links.
What our analysts watch: Three honest reads turn COT data into signal rather than noise. Position extremes versus the rolling 52-week range (a managed-money long that is at the 95th percentile of its annual range is the structural setup for a positioning unwind; the absolute number matters less than its position in the distribution). Net change versus prior week (a 20,000-contract weekly shift in commercial positioning is more informative than the static aggregate, because it captures the marginal decision the hedger pool just made). Cross-confirmation between commercials and speculators (the historically reliable signals occur when commercials reach a contrarian extreme while speculators reach the matching consensus extreme; both categories at the same extreme on opposite sides is the structural reversal pattern). Used this way the COT is a slow indicator that frames the multi-week trade thesis. Used as a short-term timing tool it disappoints, because position changes can persist for months at extremes.
Volity operates a trading platform and also publishes educational and analytical content about trading. The content on this page is for educational purposes only and should not be considered financial advice. Volity may benefit commercially when readers open trading accounts through links on this site.
Our content is produced and reviewed under documented editorial standards; see our comparison and review methodology.