A drawdown calculator measures how far a trading account has fallen from its highest point to its lowest, shown as a percentage. It also gives you the number most traders overlook, the exact gain you need to climb back to breakeven. That recovery figure grows far quicker than the loss that caused it, which is why keeping drawdown under control tends to matter more than chasing the next win.
What is a drawdown in trading?
A drawdown is the drop from a peak in your account balance to a later low, measured before a new peak is set. Push your balance to 10,000, watch it slip to 8,000, and you are sitting in a 20% drawdown. It is the clearest single read on how much pain a strategy puts you through on the way to whatever returns it produces.
Three versions of the number show up in trading platforms and strategy reports, and they answer slightly different questions.
| Type | What it measures |
| Absolute drawdown | The fall from your starting deposit to the lowest point below it. |
| Relative (current) drawdown | The percentage fall from your most recent equity peak. |
| Maximum drawdown | The largest peak-to-trough fall over the whole period. This defines a strategy’s worst historical stretch, and it is the figure professional risk desks watch most closely. |
How do you calculate drawdown?
The core formula is short, and it matches the standard definition of drawdown:
Drawdown % = (Peak balance minus Trough balance) / Peak balance x 100
The recovery figure is the part a plain percentage hides. To get back to the old peak from a trough, the gain you need is:
Recovery gain % = Drawdown / (1 minus Drawdown) x 100
Recover a 20% drawdown and you need a 25% gain, not 20%, because that gain now has to work on a balance that shrank. The deeper the hole, the steeper the climb out, and the gap keeps widening as losses get larger.
Worked example: a losing streak on a 10,000 account
Say you start with 10,000 and risk 2% of the balance on each trade. Then you hit a run of eight losses. Because each 2% comes off a shrinking balance rather than the original one, the account does not simply fall by 16%. It compounds downward to roughly 8,508, a drawdown of about 14.9%. Climbing back to 10,000 from there takes a gain of about 17.5%, not 14.9%.
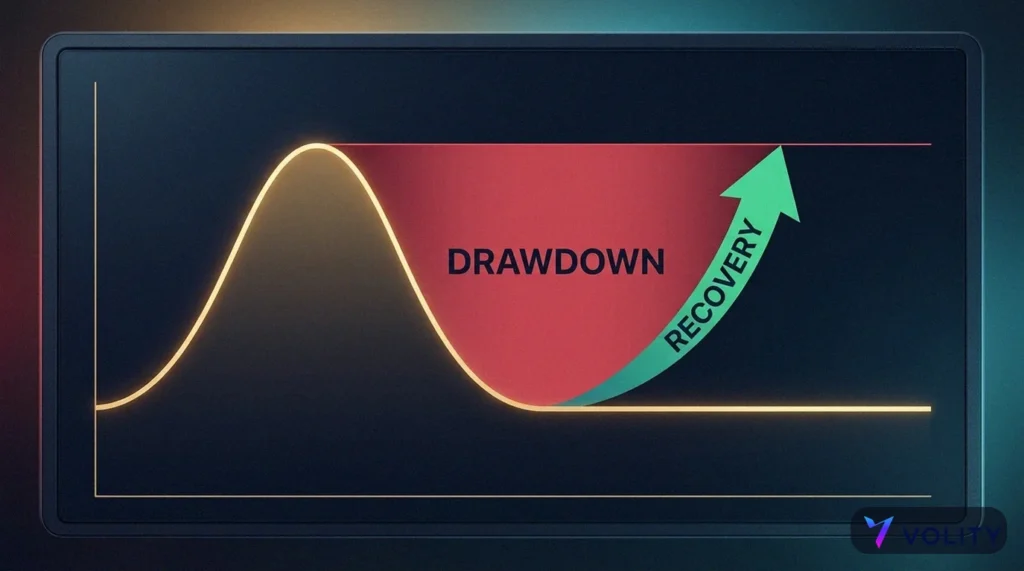
Why does a bigger drawdown need a much bigger recovery?
This asymmetry is the reason risk control beats aggression over a long career. A loss and the gain that repairs it are not the same size, and the gap gets ugly fast once drawdowns run deep, a point that shows up clearly in any study of drawdown and loss recovery.
| Drawdown from peak | Gain needed to recover |
| 5% | 5.3% |
| 10% | 11.1% |
| 20% | 25% |
| 30% | 42.9% |
| 50% | 100% |
| 75% | 300% |
| 90% | 900% |
A 10% fall is an inconvenience. A 50% fall means doubling what is left just to break even, and few strategies manage that before confidence and capital run out. Keeping maximum drawdown shallow is what buys you the time to compound, which is the whole point of risk management in trading.
Use the free drawdown calculator
Enter a peak and trough to see your drawdown, or model a losing streak by risk per trade. The highlighted figure is the gain you would need to get back to your starting point.
Past results do not guarantee future performance.
Practise position sizing on a free Volity demoHow do traders use drawdown to manage risk?
Drawdown is more than a scoreboard; it is a control you can set in advance. Traders decide on a maximum acceptable drawdown, then size positions so a realistic losing streak stays inside it. A common structure looks like this:
- Decide the deepest drawdown you will tolerate before pausing to review, say 20%.
- Cap risk per trade low enough that a plausible losing run stays under that ceiling. At 1% per trade, even a dozen losses in a row leave you well inside 20%.
- Pair the cap with a reward-to-risk ratio that lets winning trades repair losing ones quickly.
- Recalculate as the balance grows, since a fixed-percentage rule adjusts position size for you.
The habit that supports all of this is practice. Rehearse your position sizing on a free demo account first, where a rough losing streak costs data instead of capital, and get comfortable with how leverage stretches both the gains and the drawdowns before real money is on the line. The same plan pairs well with a lot size calculator to fix each position, a risk-reward calculator to weigh each setup, and a compound calculator to see how recoveries build the balance back.
Is this the same as a pension drawdown calculator?
No. This tool measures trading risk, the peak-to-trough fall in an account. A pension drawdown calculator answers a different question, estimating how long a retirement pot lasts as you draw an income from it, and if that is what you need you should use a dedicated pension drawdown tool from a regulated retirement provider.
Manage drawdown on Volity
Every position you open when trading contracts for difference on Volity carries a stop-loss field, so you can fix the loss on each trade before you commit to it. Volity MT reports running equity and balance in real time, which keeps current drawdown visible as it happens rather than after the damage is done. Leverage reaches up to 1:500 on selected forex products, and higher leverage deepens a drawdown just as fast as it lifts a gain, so size your positions from your risk plan rather than the maximum on offer. Leverage magnifies both profits and losses, which is exactly why regulators such as ESMA and the FCA stress the risk to retail traders.
Frequently asked questions
What is a good maximum drawdown?
There is no universal figure, though plenty of disciplined retail traders treat a maximum drawdown above 20% to 25% as a signal to stop and review the strategy. Professional fund mandates are often tighter again. The lower your maximum drawdown, the smaller the recovery gain you ever have to find, which is why shallow beats spectacular.
What is the difference between drawdown and maximum drawdown?
Current drawdown is how far you sit below your most recent equity peak right now. Maximum drawdown is the largest peak-to-trough fall recorded across the whole test or trading history. Current drawdown moves every day, while maximum drawdown only updates when a new worst stretch happens, and it stands as the strategy’s historical worst case. You can read more in the maximum drawdown definition.
How do I recover from a large drawdown?
Reduce position size rather than increase it, because trying to win the loss back quickly usually digs the hole deeper. Go back to your tested strategy and keep risk per trade small so the recovery gain builds on a stable base. A 50% drawdown needs a 100% gain to recover, so the realistic route is patience over a bigger bet.
Sources
- Corporate Finance Institute , Drawdown definition and formula
- WallStreetMojo , Maximum Drawdown (MDD)
- StockCharts ChartSchool , Risk Management in Trading
- Wikipedia, Drawdown (economics)
- BabyPips, Drawdown and Maximum Drawdown
- Corporate Finance Institute, Maximum Drawdown
- ESMA, retail CFD product intervention measures
- FCA, consumer guidance on high-risk investments
- CMC Markets, trading education glossary
- MoneyHelper, Pension drawdown explainer