Its near-bodiless relative is the gravestone doji, where the open and close finish together down at the low after buyers fail to hold a rally.
The bullish mirror image of this candle is the inverted hammer, an identical long-wicked bar that shows up at the bottom of a downtrend rather than the top.
A shooting star is the single-candle version of a bigger idea, the rejection block, a zone drawn from the cluster of long upper wicks where price was rejected.
Shooting Star signals are close to a coin flip on their own and are only worth acting on when they form at a level that already mattered; false signals occur frequently on lower timeframes. Confirmatory candles must close below the pattern for validity, but market reversals can fail rapidly. Leverage amplifies losses from failed reversals. Past performance is not indicative of future results. Capital at risk.
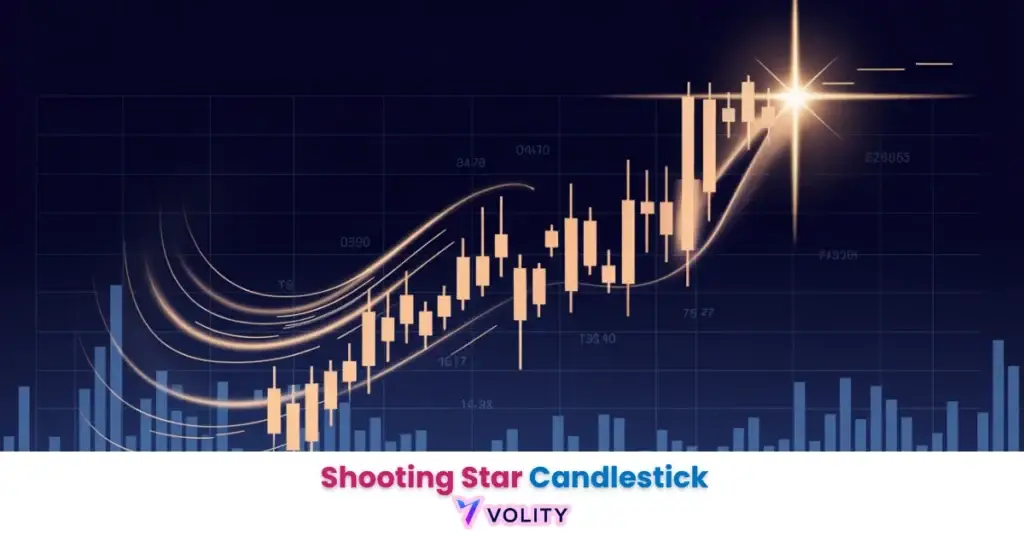
The Shooting Star is a bearish reversal candlestick pattern featuring a small body at the lower end of the range with an extended upper wick, signaling buyer exhaustion at resistance. Thomas Bulkowski’s tested statistics put the pattern at a bearish reversal 59% of the time, which he calls near random, so confirmation and location do all the work. This pattern identifies the exact moment sellers overpower buyers after an extended uptrend.
The Shooting Star functions as the inverse of the Hammer candlestick, identifying the precise moment when buyers exhaust themselves at resistance. The extended upper wick represents attempted upside momentum that reversed sharply during the same session, indicating strong rejection of higher prices. This pattern appears at the end of uptrends, marking potential reversal points.
The 2026 trading environment produces Shooting Stars frequently at algorithmic resistance levels where institutional traders set sell orders. Recognizing these patterns enables traders to exit long positions before major reversals occur.
While understanding Forex is important, applying that knowledge is where the real growth happens. Create Your Free Forex Trading Account to practice with a free demo account and put your strategy to the test.
What is a Shooting Star candlestick pattern?
A Shooting Star is a bearish reversal pattern with a small body positioned at the lower end of the candle range and a long upper wick at least 2-3 times the body height.
The pattern forms when price rallies sharply during the session but closes near the open, demonstrating that buyers were aggressive initially but sellers reclaimed control before the close. The long upper wick is the record of that rejection: buyers pushed price up and could not hold it. Shooting Stars are only worth taking at a level that already mattered; the same shape in the middle of a range carries no information.
Pattern validity requires: (1) Small body, (2) Long upper wick (2-3x body height), (3) Formation at or near resistance, (4) Confirmation from next candle closing lower.
Ready to Elevate Your Trading?
You have the information. Now, get the platform. Join thousands of successful traders who use Volity for its powerful tools, fast execution, and dedicated support.
Create Your Account in Under 3 MinutesHow do you identify a Shooting Star at resistance?
Location is the whole edge. Look for the pattern to form exactly at prior swing highs, at trendline resistance or at round numbers where resting sell orders cluster; the same candle in open space is noise.
Shooting Stars at support levels within uptrends are continuation patterns, not reversals, these should be ignored or treated as bounces. The context, where on the chart the pattern forms, determines its predictive value. A Shooting Star after a 200-pip rally at a 6-month resistance level is highly significant; a Shooting Star mid-range after 30 pips of movement is noise.
Worked illustration of the sequence, not a record of a trade. A pair rallies into a level that has capped it for months and prints a candle with a long upper wick and a small body near the low. The next candle closes below that low, which is the confirmation; the entry is on that close, the stop sits above the wick, and the target is a multiple of that distance. If the confirmation candle never closes below the low, there is no trade. Past performance is not indicative of future results.
A red-bodied Shooting Star is statistically stronger than a green one, indicating sellers dominated the entire session including the close.
How reliable are Shooting Stars compared to Hammers?
Neither pattern is reliable on its own. Bulkowski ranks the Shooting Star 55th of 103 candlestick patterns for overall performance and 37th for frequency, and finds it resolves as a bearish reversal 59% of the time. Location at support and resistance and a confirming close are what make either pattern tradeable. Shooting Stars appear at tops during uptrends; Hammers appear at bottoms during downtrends. The reliability depends on location and confirmation, not the pattern type itself.
Volume confirmation matters for both patterns: a Shooting Star printed on a clear volume expansion tells you the rejection was widely participated in, while a thin-volume one may be a single order. Combining the candle with indicator divergence, such as RSI failing to reach prior highs or a declining MACD histogram, filters out setups rather than raising a hit rate.
| Pattern | Location | Bulkowski rank (of 103) | Body Color Bias | Confirmation |
| Hammer | Support | Frequency 24, performance 39 | Green stronger | Next candle higher |
| Shooting Star | Resistance | Frequency 37, performance 55 | Red stronger | Next candle lower |
| Both | Major Level | Neither ranks in the top third | Aligned with trend | Volume + candle |
Ranks and hit rates from Thomas Bulkowski’s tested candlestick statistics, thepatternsite.com. Lower ranks are better; both patterns sit mid-table.
WARNING: Shooting Stars without confirmation candle closure are not true reversals; many failed Shooting Stars reverse again higher, trapping short sellers.
How do you trade Shooting Star patterns?
Shooting Star entries require waiting for the confirmation candle to close fully below the pattern’s low before shorting.
Sell on the confirmation candle close if it closes below the Shooting Star low, placing the stop-loss 3-5 pips above the upper wick. Taking profit at 1.5 to 2 times the risk distance keeps the trade’s expectancy positive at a hit rate barely better than a coin flip. Never short the Shooting Star candle itself, wait for the next candle to confirm bearish momentum continuation.
Placing sell stops below Shooting Stars identified on Daily charts creates automated entries when confirmation occurs, enabling traders to sleep through London/New York sessions while capturing Asian/European reversals.
💡 KEY INSIGHT: The most effective Shooting Star trades occur when the pattern forms at round numbers (1.0950, 195.50) where institutional sell orders automatically trigger, creating self-fulfilling reversals.
Turn Knowledge into Profit
You have done the reading, now it is time to act. The best way to learn is by doing. Open a free, no-risk demo account and practice your strategy with virtual funds today.
Open a Free Demo AccountWhat timeframe is best for Shooting Star patterns?
Higher timeframes are more reliable for a simple structural reason: a daily candle aggregates a full session of order flow, so a long upper wick on it represents a rejection that many participants took part in. The same shape on a 15-minute chart can be one large order. Bulkowski’s statistics are calculated on daily data, and there is no published equivalent for intraday timeframes.
Professional traders focus Shooting Star reversals on Daily and 4-hour charts, avoiding lower timeframe noise. Confirming a daily Shooting Star against the 4-hour chart, checking that selling pressure shows there too, removes setups rather than improving the odds on the ones that remain.
Key Takeaways
- Shooting Stars are bearish reversal patterns featuring small bodies at lower range with extended upper wicks exceeding 2-3x body height.
- Bulkowski’s tested statistics put the Shooting Star at a bearish reversal 59% of the time, which he describes as near random; location and confirmation are what make it tradeable.
- Confirmation from the next candle closing lower is mandatory; an unconfirmed Shooting Star is not a signal at all.
- Red-bodied Shooting Stars are statistically stronger than green ones, indicating seller domination throughout the session.
- Volume expansion tells you the rejection was widely participated in; thin-volume patterns often fail and trap short sellers.
- Daily and 4-hour charts aggregate enough order flow for the wick to mean something; on lower timeframes the same shape is frequently a single order.
Frequently Asked Questions
This article contains references to Shooting Star patterns, Candlestick Analysis, and Volity, a regulated CFD trading platform. This content is produced for educational purposes only and does not constitute financial advice or a recommendation to buy or sell any financial instrument. Always verify current regulatory status and platform details before using any trading service. Some links in this article may be affiliate links.