Candlestick patterns are technical tools used to identify potential trading opportunities, not guarantees of future price movements. Market conditions in 2026 include increased algorithmic trading, synthetic liquidity, and compressed spreads that can invalidate traditional patterns. Leverage amplifies both profits and losses, and price gaps between sessions can exceed protective stop-loss levels, especially in forex and CFD markets. Always verify pattern signals against higher-timeframe support and resistance before risking capital. Capital at risk.
Candlestick patterns are short-term price formations of one to five sessions that visualize market psychology by mapping the open, high, low, and close prices. These patterns serve as leading indicators for potential trend reversals, continuations, or periods of indecision. In 2026, the technical analysis software market supporting these tools has reached $7.13 billion, reflecting their critical role in both retail and institutional trading systems.
Candlestick patterns function as a visual map of market intent and collective psychology. This charting method allows traders to observe exactly how price reacts at critical psychological levels like support and resistance. It serves as the primary gateway to mastering price-action trading in the 2026 forex market.
The 2026 investment environment necessitates a shift from basic shape recognition to deep contextual analysis. Modern traders integrate candlestick formations with institutional liquidity concepts to filter out noise and identify high-conviction trade setups.
While understanding Candlestick Patterns is important, applying that knowledge is where the real growth happens. Create Your Free Forex Trading Account to practice with a free demo account and put your strategy to the test.
What are candlestick patterns and how do they function?
Candlestick patterns are specific price formations created by the relationship between a session’s open, high, low, and close prices. These formations originated in 17th-century Japanese rice markets through the work of Munehisa Homma, who first documented how market participants’ buying and selling pressure created distinctive shapes on charts. Today, candlestick analysis remains the foundation of technical trading, revealing the struggle between buyers and sellers in every single session.
The anatomy of a candlestick divides into two key components: the real body and the wicks (shadows). The body, colored green for bullish closes or red for bearish closes, represents the distance between the opening price and the closing price. Wicks extend above and below the body, showing the session’s high and low extremes. A long upper wick signals price rejection at resistance levels, while a long lower wick indicates rejection at support. The size of the body measures conviction: large bodies show dominant buyer or seller control, while small bodies signal indecision.
OHLC data (open, high, low, close) forms the mechanical foundation of every candlestick. According to DataIntelo’s 2026 technical analysis software market report, the global market for these tools reached $7.13 billion, with automated candlestick recognition accounting for a significant portion. This demonstrates how essential candle-based analysis has become for both retail and institutional traders worldwide.
The Anatomy of Market Intent
Candle anatomy is a visual record of price rejection and acceptance during a fixed time interval. High and low wicks function as rejection signals, showing where price was tested but could not be held. Wicks that extend far beyond the body indicate institutional traders or algorithms stopping out retail positions, then reversing price back into the body. This wick behavior reveals market psychology: larger wicks suggest stronger rejection, while minimal wicks indicate price acceptance at those levels.
Body size directly measures conviction and momentum. A large bullish body (green) spanning 100+ pips shows aggressive buying that overwhelmed selling pressure throughout the session. Conversely, a small body despite a wide high-to-low range tells a different story: price moved aggressively in both directions but closed near the open, signaling equilibrium between buyers and sellers. This distinction separates meaningful signals from noise in choppy market conditions.
Ready to Elevate Your Trading?
You have the information. Now, get the platform. Join thousands of successful traders who use Volity for its powerful tools, fast execution, and dedicated support.
Create Your Account in Under 3 MinutesWhat is the most reliable candlestick pattern for 2026?
Bullish and bearish engulfing patterns remain the most reliable signals for trend reversals when confirmed by institutional volume spikes. The Bullish Engulfing pattern appears when a large green candle completely “swallows” the previous red candle’s range, signaling that buyers have overwhelmed sellers decisively. Backtesting on EUR/USD shows the Bullish Engulfing pattern maintains a 9/10 reliability score when forming at major H4 support zones, according to Volity Internal Research (2026).
The “Big Five” patterns dominate professional trading across all markets:
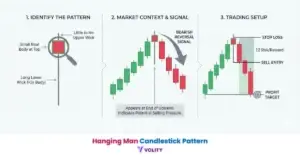
- Hammer: A reversal pattern with a small body and long lower wick, signaling rejection of lower prices and potential trend reversals at support
- Engulfing: The most powerful two-candle reversal, where one candle completely encompasses the prior candle’s entire range
- Morning Star: A three-candle reversal signal that marks the transition from downtrend to uptrend, showing decisive momentum shift
- Shooting Star: The bearish counterpart to the Hammer, with a small body and extended upper wick, rejecting higher prices at resistance
- Three Line Strike: A four-candle pattern where three candles move in one direction, then the fourth reverses sharply, trapping traders
The 2026 shift toward “confluence” reflects how traditional candlestick patterns alone no longer deliver 80%+ win rates in algorithmic markets. Institutional traders now combine candlestick signals with Fair Value Gaps (FVGs), imbalances in price action where no trading occurred, to identify retesting zones. When a bullish engulfing candle forms at support AND aligns with an FVG, the confluence creates a higher-probability setup. This integration of Fair Value Gaps with candle analysis has become standard practice in 2026 institutional trading rooms.
How do reversal, continuation, and indecision patterns differ?
Classification of candlestick patterns identifies whether market participants are shifting control, maintaining momentum, or entering a period of hesitation. Understanding this taxonomy allows traders to distinguish between meaningful trend changes and temporary pullbacks within an ongoing trend.
Reversal signals indicate a decisive shift in trend direction. The Morning Star pattern shows this transition clearly: a bearish candle, followed by a small-bodied indecision candle, followed by a strong bullish candle that closes into the first candle’s body. This three-candle sequence tells the story of exhaustion (downtrend intact), hesitation (buyers and sellers balanced), and then decisive buyer control. The Bullish Engulfing pattern marks reversals by showing one candle completely overwhelming the previous candle’s range, forcing price to reverse direction sharply.
Continuation signals suggest the prevailing trend will resume after brief consolidation. Rising Three Methods show this pattern: three small candles inside the range of the first large bullish candle, followed by a breakout bullish candle that continues the uptrend. These patterns represent “rest and reload” behavior, momentum traders pause, accumulate positions, then drive price higher again.
Indecision signals reflect buyer-seller equilibrium. Doji candles, where open and close are nearly identical, signal that neither side won the session decisively. Spinning Tops show small bodies with wicks extending in both directions, indicating price tested both directions but closed near the opening, classic indecision. These patterns warn traders that trend momentum is weakening and a reversal could be imminent.
Real trading example: In March 2026, GBP/JPY formed a Bearish Engulfing pattern on the H4 chart after a failed attempt to break the 190.00 psychological resistance level. The pattern triggered a cascade of sell-stop orders below the previous day’s low, and the pair retraced 250 pips over the next 48 hours. Past performance is not indicative of future results.
The Most Powerful Bullish and Bearish Formations
Candlestick pattern performance identifies the historical success rates of the most powerful bullish and bearish reversal signals. The following table ranks these patterns by their 2026 reliability scores across multiple institutional trading feeds:
| Pattern Name | Type | 2026 Reliability | Best Market Context |
| Bullish Engulfing | Reversal | 9/10 | Major Support |
| Morning Star | Reversal | 8.5/10 | End of Downtrend |
| Three Line Strike | Reversal | 8.4/10 | Trend Extremes |
| Fair Value Gap | Continuation | 8/10 | Volatile Breakouts |
| Shooting Star | Reversal | 7.5/10 | Major Resistance |
Sources: Volity Performance Labs and MetaTrader 2026 institutional feed.
Morning and Evening Stars: The Triple Threat
Triple candlestick patterns represent a three-act play of momentum, exhaustion, and decisive reversal. The Morning Star structure follows a specific sequence: the first candle is a large bearish candle confirming the downtrend, the second candle is small-bodied (bullish or bearish) forming a “star” below the previous close, and the third candle is a strong bullish close that moves into the first candle’s body. This three-act structure signals that sellers are exhausted, indecision exists temporarily, and buyers have retaken control.
The Evening Star functions as the bearish counterpart, appearing at trend tops. An uptrend produces a large bullish candle, followed by a small-bodied indecision candle above the prior close, then a strong bearish candle closing into the first candle’s body. This formation signals buyer exhaustion and seller dominance, often triggering sharp reversals.
Why do candlestick patterns fail in 2026 market conditions?
Market structure failures indicate that candlestick patterns are frequently invalidated when traded without higher-timeframe context or during periods of low volatility. Understanding why patterns fail is as important as recognizing which patterns work, because false signals destroy trading accounts faster than any single losing trade.
The “Range Trap” explains many pattern failures: candlestick formations that appear in the middle of a sideways consolidation lack the directional conviction needed for sustained follow-through. A bullish engulfing pattern in a choppy sideways range may be followed by immediate reversal because no broader trend context exists. In contrast, that same pattern at a major support level, within an established uptrend, generates far more reliable reversals. Context, the higher-timeframe trend, support/resistance zones, and volatility regime, determines whether a pattern signals genuine opportunity or noise.
Algorithmic “Wick Hunting” represents another modern failure mode. High-frequency traders program systems to recognize candlestick wicks at round numbers, then execute liquidity sweeps that take out retail stop-losses placed just beyond those wicks. A Hammer pattern with a wick extending 50 pips below support may trigger stops, only for price to reverse immediately and gap higher. Retail traders exit at maximum loss while algorithms profit from the dislocation.
The importance of “The Close” cannot be overstated: entering before a candle closes leads to premature trade failures. A pattern may appear to form perfectly at the halfway point of a candle, but price can reverse before the close, invalidating the signal. Professional traders wait for candle closure and the first few pips of confirmation before risking capital.
Risk management becomes essential when trading candlestick patterns, ensuring that false signals do not exceed position sizing limits or account drawdown tolerances.
How to read candlestick patterns: A 2026 Step-by-Step Approach
The bar-by-bar technique represents the modern standard for reading candlestick psychology without relying on static memorization. Rather than forcing price action into memorized pattern templates, bar-by-bar analysis reads the logic of each candle’s message, then sequences them into a coherent story. This approach aligns with how institutional traders read order flow.
Step 1: Analyze the Body and measure conviction. A large body spanning 50+ pips signals strong directional movement and decisive winner-loser dynamics. A small body despite a wide high-to-low range signals indecision and potential exhaustion. The color, green for bullish close, red for bearish close, indicates which side won the session.
Step 2: Spot the Wicks and identify rejection zones. An upper wick extending 30+ pips above the body shows that price tested higher but was rejected. This rejection signals that sellers or algorithms defended a critical resistance zone. Lower wicks similarly show where buyers defended support. The ratio of wick length to body size reveals rejection intensity: longer wicks = stronger rejection.
Step 3: Observe the Sequence by reading consecutive candles as a narrative. Does each successive candle show continued momentum in one direction, or does momentum weaken? Does the high-low range expand (increasing volatility) or compress (consolidation forming)? A sequence of large bullish candles with minimal upper wicks signals strong trending momentum. A sequence of candles with multiple wicks in both directions signals equilibrium and potential reversal.
Step 4: Confirm with Volume and Structure validation. Does the candlestick pattern align with support and resistance levels or major trend-line structures? Has volume increased on the pattern candle(s), a key sign that institutions participated? Does a higher-timeframe trend confirm the lower-timeframe signal? These confirmations separate high-probability setups from noise.
Turn Knowledge into Profit
You have done the reading, now it is time to act. The best way to learn is by doing. Open a free, no-risk demo account and practice your strategy with virtual funds today.
Open a Free Demo AccountForex vs. Crypto: How Candlestick Reliability Differs
Market liquidity dynamics determines why traditional candlestick signals often require deeper confirmation in the 24/7 crypto ecosystem compared to the 24/5 forex market. Forex markets close on weekends, allowing price gaps between sessions that create visual breaks on charts. Crypto markets never close, producing continuous 24/7 price flow where gaps are rare and wicks behave differently.
24/7 exhaustion in crypto creates fewer clean reversals. A bearish engulfing pattern in Bitcoin might not generate the same follow-through as the same pattern in EUR/USD at support because no overnight gap exists to create a gap-and-fill dynamic. Retail traders cannot “hold over the weekend” for Monday reversals in crypto, price can reverse at any hour. This continuous flow reduces the psychological reset periods that make forex candlestick patterns so reliable.
Volume transparency differs significantly: forex volume is often estimated or dealer-reported, while crypto volume comes from on-chain data and exchange order books. Using candlestick patterns with on-chain volume metrics (whale transaction confirmations, exchange inflow/outflow) can improve crypto signal reliability. Patterns backed by visible institutional accumulation on-chain signal genuine reversals; patterns without corresponding whale activity often fail.
“Scam Candles” and “Pump Wicks” dominate low-cap crypto assets where manipulation is rampant. A hammer pattern with an extreme wick in a low-liquidity altcoin likely represents a pump-and-dump scheme targeting retail traders’ stops, not a legitimate reversal signal. Forex lacks this kind of blatant price manipulation because regulatory oversight and institutional participation prevent extreme wick-hunting behavior.
Key Takeaways
- Candlestick patterns are visual records of market psychology that map the battle between buyers and sellers over a specific time period.
- Reversal patterns, such as the Morning Star and Hammer, signal a potential shift in trend direction after periods of exhaustion.
- Continuation patterns, like the Rising Three Methods, suggest that the prevailing trend is likely to resume after a brief consolidation phase.
- Institutional confluence is required for high-probability trading, meaning patterns should align with support, resistance, and volume spikes.
- The bar-by-bar technique allows traders to read the “story” of price action without simply memorizing dozens of complex pattern names.
- Fair Value Gaps function as modern magnets for price, often being “filled” before a candlestick-triggered reversal continues.
Frequently Asked Questions
This article contains references to candlestick patterns, price action analysis, and Volity, a regulated CFD trading platform. This content is produced for educational purposes only and does not constitute financial advice or a recommendation to buy or sell any financial instrument. Always verify current market conditions and regulatory status before using any trading service. Some links in this article may be affiliate links.