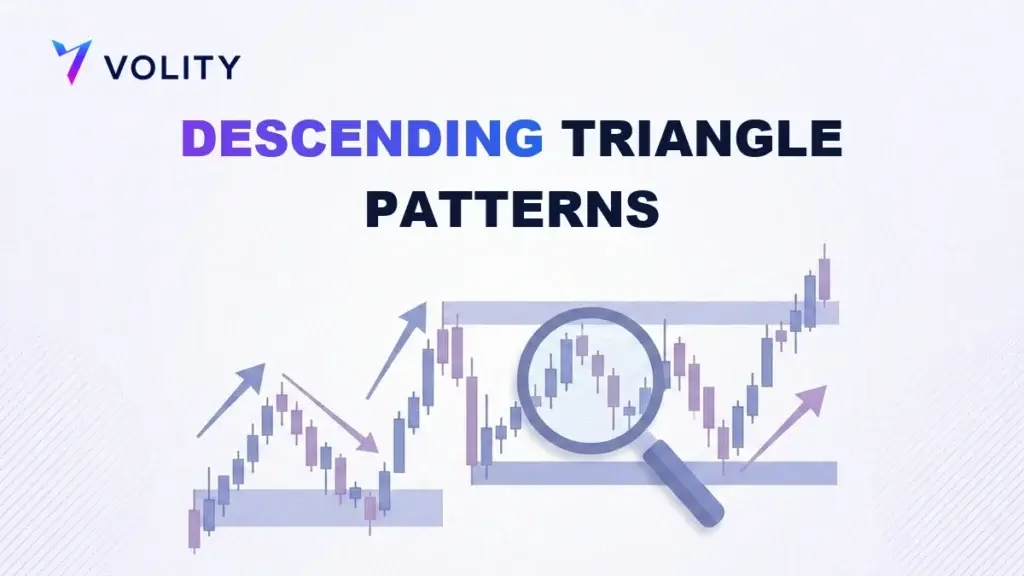
A descending triangle pattern forms when price prints lower highs against a flat horizontal support line, drawing a triangle that points down. It is usually a bearish continuation signal. When support finally breaks, price tends to fall by roughly the height of the triangle, though the same shape can also mark a top.
What is a descending triangle pattern?
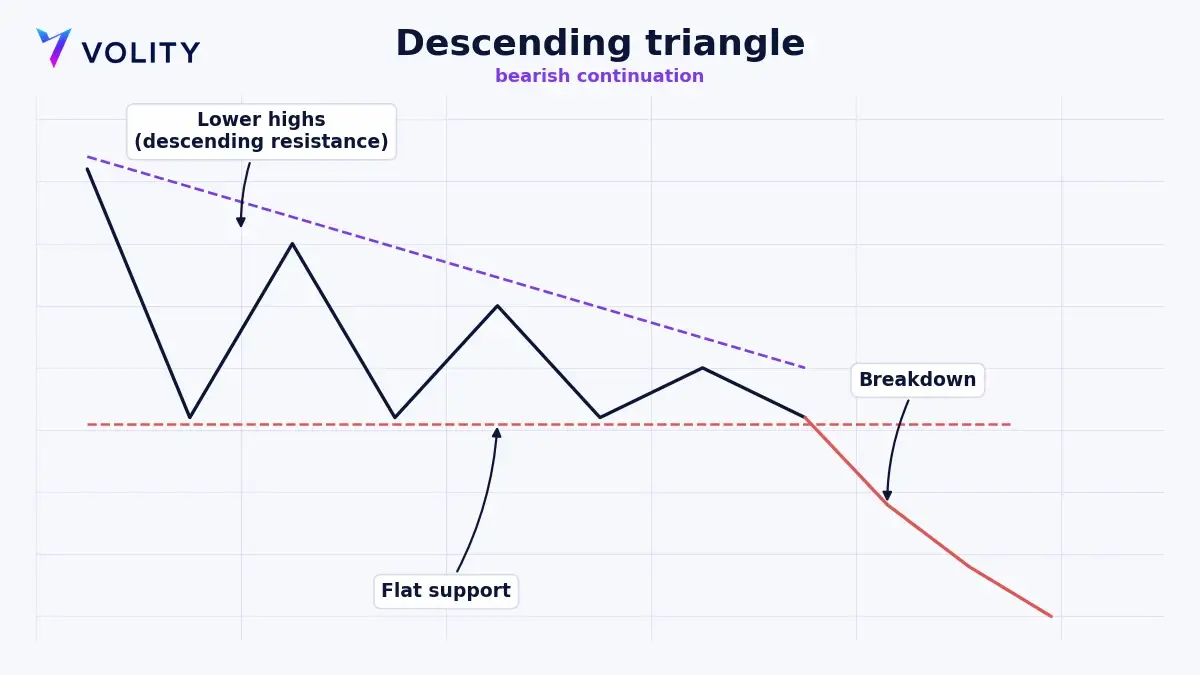
A descending triangle is drawn with two lines. The lower line is flat, a horizontal support level where buyers keep stepping in at about the same price. The upper line slopes down, connecting lower highs where sellers keep entering earlier and earlier. As the two lines converge, the range tightens and a decision point approaches.
The story inside the shape is simple. Sellers are getting more aggressive with each rally, capping price below the previous high. Buyers are holding a fixed line in the sand. Something has to give, and because the pressure is building from above, the flat floor is the wall that usually cracks. That is why descending triangle patterns lean bearish.
You will spot the cleanest examples inside an existing downtrend, where the pattern acts as a pause before the move continues. A valid descending triangle needs at least two touches of the horizontal support and two lower highs along the falling trendline. More touches make the level more meaningful and the eventual break more reliable.
Is a descending triangle bullish or bearish?
A descending triangle is read as bearish by convention. The falling highs show sellers pressing earlier on every rally, and the flat base is the line they are pressing against, so the textbook reading is a continuation of the prevailing trend once that floor gives way.
That convention is not a guarantee, and it is worth being blunt about it: descending triangles break in both directions, often enough that the direction of the break is not something to assume in advance. An upward resolution is common when the wider trend is up and the triangle is really a consolidation before more buying. This is the mirror image of the ascending triangle, which has a flat ceiling and rising lows. Do not marry the bias. Trade the break that actually prints rather than the one you expected.
How do you trade a descending triangle breakout?
The plan is the same whether you are trading an index, a currency pair, gold or a crypto CFD. You wait for the break, confirm it, and manage the risk from the structure itself.
- Mark the two lines first, drawing the horizontal support under the equal lows and the descending trendline across the lower highs.
- Wait for a candle to close clearly below support, ideally on rising volume, because an intrabar poke that snaps back is not a real break.
- Enter on the break or the retest. Aggressive traders sell the breakdown close, while patient traders wait for price to pull back to the broken support, which often flips into resistance, and sell the rejection.
- Place the stop above the last lower high, since a move that reclaims the range invalidates the pattern cleanly.
- Project the measured move by taking the height of the triangle at its widest and subtracting that distance from the breakout point for your primary target.
The measured move is a guide rather than a promise. Many traders bank part of the position at the target and trail the rest with a moving average or a lower swing high, letting a strong trend run past the projection.
Descending triangle vs ascending, symmetrical and wedge patterns
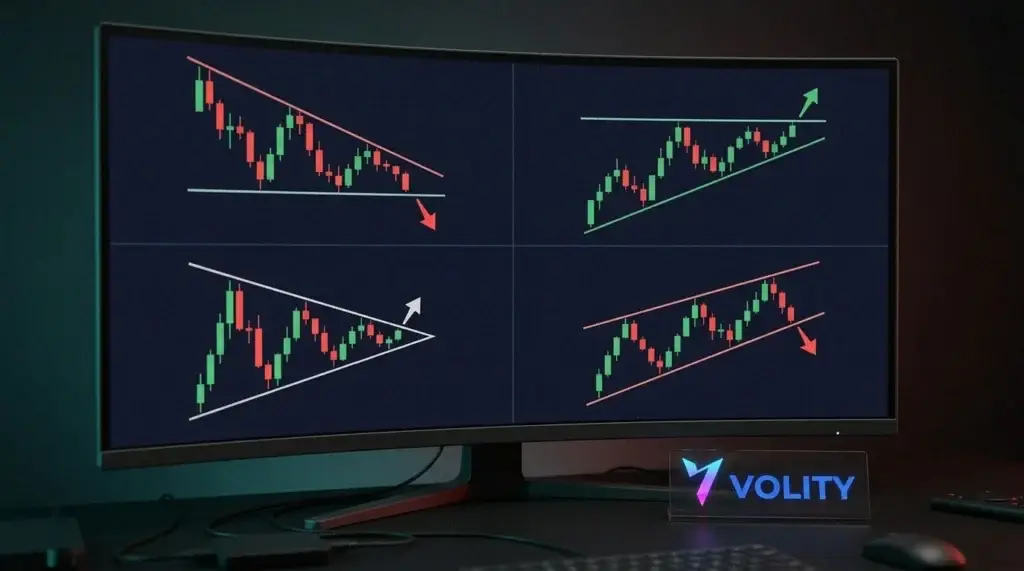
The descending triangle belongs to a wider triangle and wedge pattern family. They look similar at a glance, so read the two lines carefully before you trade. The table below separates the shapes and their usual bias.
| Pattern | Upper line | Lower line | Usual bias |
| Descending triangle pattern | Falling (lower highs) | Flat support | Bearish breakdown |
| Ascending triangle pattern | Flat resistance | Rising (higher lows) | Bullish breakout |
| Symmetrical triangle pattern | Falling | Rising | Continuation, either way |
| Rising wedge pattern | Rising | Rising (steeper) | Bearish |
| Descending wedge pattern | Falling | Falling (steeper) | Bullish |
Two distinctions matter most. An ascending triangle flips the roles, with a flat ceiling and rising lows, so buyers are the aggressors and the break usually goes up. A symmetrical triangle has both lines converging, so it carries no built-in bias and simply continues the trend it interrupted. The rising and falling wedge patterns slope in one direction and tend to resolve against that slope, which is why a rising wedge reads as bearish and a descending wedge as bullish.
What makes a descending triangle fail?
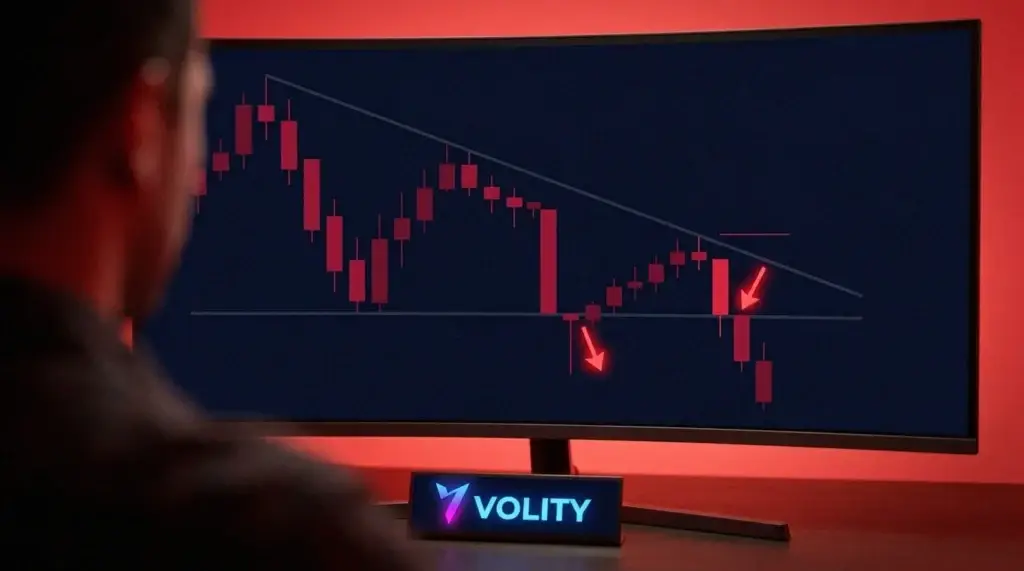
The most common trap is the false break. Price stabs below support, triggers stops, then closes back inside the triangle. This is why waiting for a candle close beyond the line, rather than an intrabar spike, filters out a large share of losing entries. Volume helps too, since a genuine breakdown usually expands volume while a fake tends to fade on thin participation.
Context is the other filter. A descending triangle that forms after an extended downtrend, deep into a move, may be a late-stage pattern with little room left to run. One that forms against a strong higher-timeframe uptrend is more likely to break upward like a bullish continuation, closer to how a descending wedge pattern behaves. Check the trend one or two timeframes up before you commit, and size the position so a single false break cannot damage your account.
How does a descending triangle play out?
A quick worked example makes the pattern concrete. Imagine an index CFD has been sliding, then stalls and bounces three times off the same 15,000 support, while each rally tops out lower, at 15,300, then 15,220, then 15,160. Those equal lows draw your flat floor and the falling highs draw your descending trendline. The height of the triangle is 300 points, measured from the 15,300 high down to the 15,000 support.
When a daily candle finally closes at 14,950, below the 15,000 floor and on visibly heavier volume, the descending triangle has broken. You enter the short near 14,950, place the stop back above the last lower high around 15,170, and project the 300-point height down from the break to a measured target near 14,650. Bank part of the position there and trail the rest. Had price instead poked below 15,000 and closed back above 15,160, you would have stood aside and waited. Every decision, the entry, the stop and the target, comes straight from the structure rather than from a guess.
Trading descending triangle patterns on Volity
Chart patterns are only useful if you can act on them across the markets where they appear. On Volity you can trade the breakdown of a descending triangle as a CFD on forex pairs, major indices, gold, commodities and crypto, going short as easily as long. The Volity MT platform carries the drawing tools you need to plot the horizontal support and the descending trendline, plus the indicators to confirm the break, and it sits inside the wider discipline of technical analysis.
There is no minimum to open an account, you can invest from $1, and live trading starts from , with funding from 10 EUR, with a free demo to rehearse the setup first. Leverage is available up to 1:500 (product-dependent), which lets a modest account act on a clean setup while a stop above the last lower high keeps the risk defined, with margin shown before every order and negative balance protection in place. Execution is regulated by CySEC under UBK Markets, licence 186/12. Costs are transparent and set out in full on the charges and fees page, so you always know what a trade costs before you place it.
Related patterns
Frequently asked questions
Are descending triangle patterns always bearish?
No. The descending triangle is read as bearish by convention, because the flat support sits under a series of falling highs, but breaks do resolve upward as well, especially inside a larger uptrend. Trade the confirmed break rather than assuming the direction.
How reliable is the measured-move target?
The height of the triangle projected from the breakout is a reasonable first target and price reaches it often enough to be useful. Treat it as a guide, take partial profit there, and trail the rest if the trend keeps running.
What is the difference between a descending triangle and a descending wedge pattern?
A descending triangle has a flat support line and a falling top, and it usually breaks down. A descending wedge, or falling wedge, has both lines sloping down and typically breaks up, so the two shapes point in opposite directions despite similar names.
How long should a descending triangle take to form?
Most tradable descending triangles develop over several weeks on the daily chart, or a proportional number of bars on lower timeframes. The break tends to come before the lines fully meet, usually around two-thirds of the way to the apex.