Trading with Bollinger Bands and leveraged financial instruments carries substantial risk. Bollinger Bands identify volatility regimes but do not predict absolute price direction.
Market gaps, flash crashes, and non-normal price distributions (“black swan” events) can violate the statistical 2-standard deviation logic. Past performance is not indicative of future results.
Capital at risk.
While understanding Bollinger Bands is important, applying that knowledge is where the real growth happens. Create Your Free Forex Trading Account to practice with a free demo account and put your strategy to the test.
Bollinger Bands are a volatility-based technical analysis indicator that plot dynamic boundaries around asset price action. This tool identifies overextended market conditions by measuring standard deviation from a central moving average. Traders utilize these envelopes to distinguish between quiet consolidation and explosive trend expansion in 2026.
The 2026 trading environment, characterized by institutional AI liquidity hunting and geopolitical volatility, requires precise regime identification. Understanding the statistical probability of price containment is essential for managing risk in both crypto and forex markets.
For a channel built from raw highs and lows rather than standard deviations, compare Bollinger Bands with the Donchian channel, a purer breakout tool that sits exactly on recent price extremes.
What are Bollinger Bands in the 2026 market?
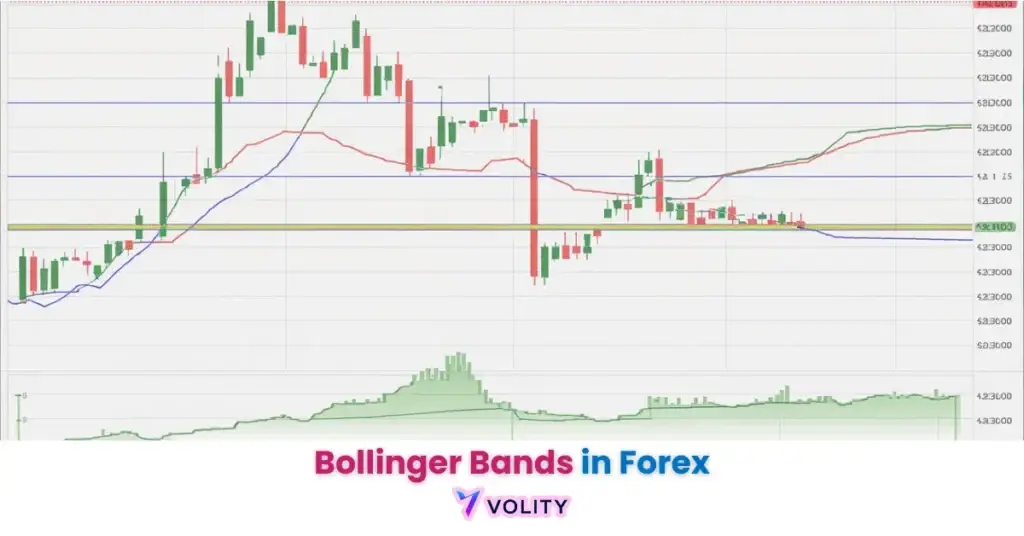
Bollinger Bands are a statistical framework that measures price volatility through dynamic envelopes centered on a simple moving average. The three-line structure consists of the Mid Band (20-period SMA), the Upper Band (SMA + 2 standard deviations), and the Lower Band (SMA – 2 standard deviations). This architecture reveals when price moves are statistically overextended. A two-standard-deviation envelope would contain about 95% of observations if returns were normally distributed, but they are not: John Bollinger’s own published rules put the practical figure at about 90%, and published studies place it near 88%, in a 85% to 90% band. Read the containment rule in John Bollinger’s published Bollinger Band rules and the study summary in the Wikipedia reference entry on Bollinger Bands.
The bands provide a relative volatility measure rather than absolute overbought/oversold signals. A price touching the upper band does not automatically signal a sell, it reveals that the move is extreme relative to recent volatility history. John Bollinger’s own rules emphasise the “%b” indicator, which measures where current price sits relative to the band envelopes: %b equals 1 at the upper band and 0 at the lower band.
How is the Bollinger Band formula calculated?
The Bollinger Band calculation is based on adding and subtracting standard deviations from a 20-period moving average. The default is a 20-period simple moving average with the bands set two standard deviations away. Bollinger’s own guidance is that the multiplier should move with the averaging period rather than with the asset: from 2 at 20 periods to about 2.1 at 50 periods, and down to about 1.9 at 10 periods, so that containment stays consistent.
Ready to Elevate Your Trading?
You have the information. Now, get the platform. Join thousands of successful traders who use Volity for its powerful tools, fast execution, and dedicated support.
Create Your Account in Under 3 MinutesHow do traders identify a Bollinger Band Squeeze?
Squeeze breakouts pair perfectly with ATR (Average True Range) for volatility-adjusted stop placement. the ATR tells you how far the new range is likely to extend.
A Bollinger Band Squeeze is a market regime characterized by extreme low volatility where the outer envelopes contract toward the middle band. The “Coiled Spring” effect occurs when markets consolidate after a sustained trend, the bands compress to their narrowest width, and volatility is suppressed. A squeeze says nothing about direction; it says only that the current volatility regime is unusually quiet by the asset’s own recent standards.
Squeezes are identified using the BandWidth indicator, which measures the distance between the upper and lower bands normalised by the mid band. Bollinger defines “The Squeeze” as BandWidth reaching a six-month low, and on the default parameters BandWidth is four times the coefficient of variation. Traders watch for that low as the setup for a potential volatility breakout, and take the direction from something other than the bands. BandWidth and The Squeeze are both defined in Bollinger’s own rules, numbers 18 and 19.
Which Bollinger Band strategies work for 2026 crypto trading?
Bollinger Band strategies in crypto identify mean reversion levels and trend continuation opportunities in highly volatile regimes. “Walking the Bands” describes price that rides the upper or lower boundary for multiple candles, indicating an exceptionally strong trend that resists mean reversion expectations. M-Top and W-Bottom reversal patterns form when price rejects the bands twice in succession, with the second rejection occurring at a lower high (M-Top) or higher low (W-Bottom).
Combining Bollinger Bands with RSI divergence gives a second, independent read on the same move. When price closes above the upper band but RSI fails to confirm with a new momentum high, the move is losing momentum even though it is still extending. No published win rate is quoted here because none that we could verify exists for this combination across major pairs.
What “walking the band” looks like in practice: after a period of compressed BandWidth, price closes outside the upper envelope and then keeps closing outside it on successive candles instead of snapping back. That sequence is the signature of a trend absorbing the mean-reversion trade, and it is why a band tag alone is not an entry. Past performance is not indicative of future results.
Bollinger Bands vs Keltner Channels: Which is better?
Most traders combine Bollingers with the RSI indicator for confirmation. bands show the volatility envelope, RSI confirms whether the touch is exhaustion or continuation.
Bollinger Bands and Keltner Channels provide distinct volatility signals based on standard deviation and Average True Range respectively. Bollinger Bands measure volatility as the absolute standard deviation of closing prices around a moving average, making them sensitive to large single-candle moves. Keltner Channels measure volatility using the Average True Range (ATR), which factors in gaps and high/low ranges, creating smoother boundaries that adapt to true market movement.
| Indicator | Property | Specification |
| Bollinger Bands | Volatility Basis | Standard Deviation |
| Keltner Channels | Volatility Basis | Average True Range (ATR) |
| Bollinger Bands | 2026 Usage | Mean Reversion |
| Keltner Channels | 2026 Usage | Trend Following |
| Squeeze Trigger | Threshold | BandWidth at a six-month low |
Bollinger Bands excel at identifying mean reversion targets and volatility extremes in choppy markets. Keltner Channels work better for trend-following strategies because ATR-based boundaries accommodate gap risk. In 2026, many traders use both tools in tandem: Bollinger Bands for entry validation and Keltner Channels for stop-loss placement.
What are the limitations of the Bollinger Band indicator?
One classic fix is layering Bollingers with a simple moving average (SMA) on a higher timeframe. the SMA filters band signals against the dominant trend.
Bollinger Bands are a lagging indicator that identifies past volatility regimes rather than predicting absolute future price direction. The bands react only after price volatility has changed, by the time bands contract into a squeeze, institutional liquidity may have already positioned for the breakout. The “Head Fake” occurs when price breaks out beyond the bands and immediately reverses, trapping retail traders on the wrong side of the move.
Non-normal price distributions violate the 2-standard deviation statistical logic. “Black Swan” events, geopolitical shocks, exchange hacks, or regulatory announcements, can produce price moves that exceed three standard deviations, which is exactly why the textbook containment assumption does not hold. Traders must understand that Bollinger Bands measure relative volatility, not absolute price extremes. A band touch does not confirm entry; it requires secondary confirmation from leading vs lagging indicators like RSI or MACD.
Turn Knowledge into Profit
You have done the reading, now it is time to act. The best way to learn is by doing. Open a free, no-risk demo account and practice your strategy with virtual funds today.
Open a Free Demo AccountWhat do Bollinger’s own rules say about reading the bands?
The clearest guidance on Bollinger Bands comes from the person who built them. John Bollinger’s official site publishes a numbered rule set, and three of the rules do most of the work. Tags of the upper band are not sell signals and tags of the lower band are not buy signals, because a tag describes position relative to recent volatility and nothing else. %b normalises that position onto a fixed scale, so it can be compared across assets and across time. BandWidth measures the width of the envelope and is what identifies a Squeeze.
The fourth rule worth memorising is the statistical one. Bollinger states plainly that no statistical assumption should be drawn from the standard deviation used in the construction, because security price distributions are not normal and a 20-observation sample is too small to support one. That is why the practical containment figure is near 90% rather than the textbook one. Use Average True Range (ATR) in conjunction with Bollinger Bands for a more complete volatility picture.
Key Takeaways
- Bollinger Bands identify volatility regimes using standard deviation envelopes around a 20-period simple moving average.
- A “Squeeze” is BandWidth reaching a six-month low, which flags a compressed volatility regime without indicating a direction.
- A squeeze is a setup, not a signal: the breakout side has to come from price structure or a momentum tool, not from the bands.
- Containment is about 90% on the default parameters by Bollinger’s own account, not the higher figure a normal distribution would predict.
- Bollinger’s own rules warn against drawing statistical conclusions from the standard deviation used to build the bands.
- Combining Bollinger Bands with RSI allows traders to identify momentum exhaustion and potential mean reversion targets.
Frequently Asked Questions
This article contains references to Bollinger Bands and Volity, a regulated CFD trading platform. This content is produced for educational purposes only and does not constitute financial advice or a recommendation to buy or sell any financial instrument. Always verify current regulatory status and platform details before using any trading service. Some links in this article may be affiliate links.
The squeeze is where the asymmetry lives: Three readings define how Bollinger Bands earn their place in a process. Bandwidth (the distance between upper and lower bands relative to the middle) signals volatility regime; multi-decade lows in bandwidth precede expansion.
Tag-and-fade behaviour at the upper or lower band only works when bandwidth is wide and the price is mean-reverting; in a trend, tags become continuation. Walking-the-band (consecutive closes touching one band) flags trend persistence, not exhaustion.
Read the regime first, the signal second.
Frequently asked questions
What settings did John Bollinger originally recommend?
John Bollinger publishes the default of a 20-period simple moving average with bands at two standard deviations as the starting point for most timeframes. He also notes that intraday and longer-horizon traders benefit from adjusting the period, but the standard-deviation multiplier should rarely move from two. The author’s own numbered rule set covers the original specification, including how the multiplier should change if the averaging period does.
What is a Bollinger Band squeeze and why does it matter?
A squeeze is a period when bandwidth contracts to a multi-month low, signalling unusually compressed volatility. Statistically, low-volatility regimes mean-revert toward higher volatility, so a squeeze flags an imminent expansion (direction unspecified). BandWidth and the Squeeze are both defined in rules 18 and 19 of Bollinger’s own rule set.
Do Bollinger Bands work the same in trending and ranging markets?
No. In a range, tags of the upper or lower band are mean-reversion candidates.
In a trend, the same tags become continuation signals (walking-the-band). Trying to fade band tags during a strong trend is one of the most common ways traders lose money on the indicator.
Always classify the regime before applying a setup.
How do Bollinger Bands compare to Keltner Channels?
Bollinger Bands use standard deviation, so they expand and contract sharply with volatility. Keltner Channels use ATR (average true range), so they shift more smoothly. Bollinger reacts faster to volatility shocks; Keltner stays steadier through them. Many traders use the two in combination as a regime-confirmation overlay.
Volity operates a trading platform and also publishes educational and analytical content about trading. The content on this page is for educational purposes only and should not be considered financial advice. Volity may benefit commercially when readers open trading accounts through links on this site.
Our content is produced and reviewed under documented editorial standards; see our comparison and review methodology.