The head and shoulders pattern is a reversal signal, not a reversal guarantee. Price can reverse at the neckline breakout, gap through it on unexpected news events, or trigger algorithmic “stop-runs” that liquidate retail positions before the actual reversal occurs. Many 2026 traders enter prematurely before the neckline closes, only to be stopped out during temporary wick-hunting that precedes the real move. Leverage amplifies losses when these false breakouts occur during volatile sessions. Capital at risk in all leveraged trading.
The head and shoulders pattern is a reliable technical indicator used to identify the transition from an uptrend to a downtrend. It consists of three distinct peaks: a higher “head” flanked by two lower “shoulders,” connected at the base by a “neckline.” In 2026, successfully trading this pattern requires more than just geometric identification; it demands volume confirmation and a strict filter for algorithmic false breakouts.
The head and shoulders pattern functions as a visual representation of the shifting power dynamics between buyers and sellers at major market inflection points. This formation provides a clear framework for traders to anticipate trend reversals with high precision. It remains one of the most widely studied chart patterns in technical analysis due to its underlying logic of institutional distribution.
The 2026 trading landscape is increasingly dominated by automated systems that hunt for traditional chart geometry. Consequently, understanding the nuances of volume confirmation and the inverse head and shoulders variant is critical for differentiating between genuine reversals and temporary liquidity traps.
While understanding Head and Shoulders Pattern is important, applying that knowledge is where the real growth happens. Create Your Free Forex Trading Account to practice with a free demo account and put your strategy to the test.
What is the head and shoulders pattern and how does it signal a reversal?
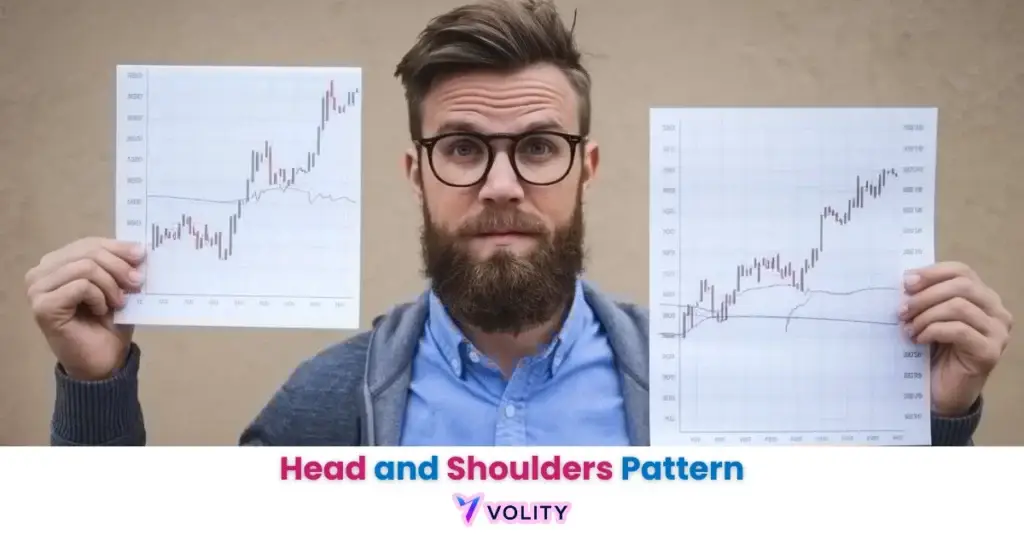
The head and shoulders pattern is a three-peak chart formation that indicates a primary trend reversal from bullish to bearish. It is one of the longest-studied formations in technical analysis; the reference definition is in the entry on the head and shoulders chart pattern.
This pattern reflects the psychology of institutional distribution. Early in the uptrend, buyers dominate and create the left shoulder, a legitimate new high. Institutional investors use this momentum to start liquidating their long positions. They push the market higher again, creating the head, an even more extreme peak. Retail buyers, seeing the new high, enter long positions right before institutions sell aggressively, creating the right shoulder. By the time the right shoulder forms, institutional selling has completely overwhelmed retail demand.
The three peaks organize this distribution across clearly identifiable price levels. The left shoulder marks the establishment of trend strength. The head marks the peak of distribution, the moment when the greatest number of retail traders are convinced the trend continues forever. The right shoulder reflects the failure of buyers to sustain momentum. Each successive peak sees less volume, while buying pressure diminishes.
Standard H&S tops signal bearish reversals in uptrends. Inverse H&S formations (inverted “V” shape) signal bullish reversals at the bottom of downtrends. The geometry inverts, but the logic is identical: three peaks arrange themselves to mark the exhaustion of the prevailing trend and the beginning of a new direction.
The neckline is the pattern’s support level and the final line of defence for the uptrend. As long as price stays above the neckline (connecting the two troughs between the shoulders and head), buyers maintain control. The moment the neckline breaks, the pattern is confirmed and the reversal begins.
Thomas Bulkowski’s published statistics for head-and-shoulders tops put the break-even failure rate at 19%, meaning about 81% of confirmed patterns see at least a 5% move after the breakout. The same page ranks the pattern 9th of 36 for overall performance and puts the average decline at 16%.
The Psychology of Distribution
Distribution is the process where institutional investors systematically sell their positions to retail buyers, forming the head and shoulders structure.
The left shoulder reflects the first stage of distribution. Buyers see new highs and feel confident in the trend. Volume is moderate to high. Institutions recognize this momentum as the moment to begin trimming positions. They sell into the strength, but the retail buying is powerful enough that they only get halfway out.
The head marks the second stage, aggressive distribution. Institutions have completely reversed to sellers. They create a spike higher by using retail FOMO (fear of missing out). This creates the head: an extreme peak that should not exist if the trend were truly healthy. The volume on the head is deceptively strong because both institutions and retail are buying. But institutional selling is hidden within that volume as hidden short sales and sells-to-open.
The right shoulder marks the failure of the trend to continue. Retail buyers, confident after seeing the head, place buy orders around the level of the previous shoulder. But institutions have largely exited. Fresh buyers aren’t stepping in with the same force. The right shoulder fails to reach the head’s height, signaling that the buying power has truly evaporated.
Ready to Elevate Your Trading?
You have the information. Now, get the platform. Join thousands of successful traders who use Volity for its powerful tools, fast execution, and dedicated support.
Create Your Account in Under 3 MinutesHow to identify the head and shoulders pattern and its key features?
Identification of the head and shoulders pattern requires three distinct price peaks and a consistent support level known as the neckline.
The left shoulder forms during a strong uptrend. This peak is higher than prior resistance and represents legitimate buying momentum. The height of this shoulder becomes a reference point for measuring whether the right shoulder is weaker.
The head is the highest of the three peaks. It should be clearly higher than the left shoulder. If the head is only slightly higher, the pattern lacks conviction. A head that clears the shoulders decisively makes the pattern easier to identify and harder to argue with. One that clears them by a fraction is a judgement call, and the published statistics below are measured on patterns that a human analyst was willing to label, not on marginal ones.
The right shoulder is the critical element. It must fail to reach the height of the head. This failure is what confirms that institutional distribution has broken the uptrend. A right shoulder that reaches or exceeds the head’s height invalidates the pattern, the trend continues higher instead of reversing.
The neckline connects the two troughs: the trough between the left shoulder and head, and the trough between the head and right shoulder. Ideally, these two troughs are at similar price levels, creating a horizontal neckline. Some patterns have slightly upward or downward-sloping necklines, which affects the pattern’s reliability.
Volume signature is critical. The head typically shows high volume because both institutions and retail buyers are active. The right shoulder shows declining volume compared to the head. This volume divergence signals that buying momentum is truly evaporating, not just pausing. Roughly two thirds of confirmed head-and-shoulders tops pull back to the neckline after the initial breakout: Bulkowski’s published pullback rate is 68%. That is why the retest entry below is a realistic plan rather than a hopeful one, and it is also why a pullback is not itself evidence the pattern has failed.
Trading strategies for the head and shoulders pattern in 2026
Strategic execution of head and shoulders trades relies on neckline breakout confirmation and retest discipline to filter out algorithmic noise.
The breakout entry executes the moment price closes below the neckline on a candle with above-average volume. This approach captures the full move but risks being stopped out by algorithmic wick-hunting that briefly penetrates the neckline to trigger retail stops. Conservative traders wait for a full hourly or daily candle close below the neckline before executing.
The retest entry waits for price to return to the neckline after the initial breakdown. On the retest, the neckline becomes resistance (not support), and the second touch often offers a lower-risk entry. A trader spots the head and shoulders, waits for the breakout, then enters when price retests the neckline from below. This sacrifices some of the early move but dramatically improves win rates by filtering out false breaks.
Stop-loss placement is non-negotiable. Place the stop above the right shoulder’s high, giving enough room to avoid algorithmic wick-hunting while still protecting against pattern invalidation. A buffer of roughly 10 to 20 pips above the right shoulder is a common convention on the majors, scaled to the instrument’s volatility. This placement protects capital if the pattern fails and price reverses upward.
How the measured move is calculated: take a head and shoulders top on EUR/USD‘s daily chart. Measure the vertical distance from the head down to the neckline. Project that same distance downward from the point where price closed below the neckline, and that is the target. If the head sits 100 pips above the neckline, the projection is 100 pips below the break. Bulkowski’s published rate for actually reaching that target is 51%, so it is a planning level rather than an expectation, and it is one reason partial exits are common. Past performance is not indicative of future results.
How reliable is the head and shoulders pattern and what are the success rates?
Head and shoulders reliability metrics identifies the historical success rates and target achievement probabilities across different market cycles.
| Pattern Type | Sees a 5% Move | Meets Price Target | Average Move | Best Timeframe |
| H&S Top | 81% | 51% | -16% | Daily / Weekly |
| Inverse H&S | 89% | 71% | +45% | Daily / Weekly |
| Busted H&S | Not published | Not published | Not published | Daily |
| Intraday H&S | Not published | Not published | Not published | Under 1 hour |
| Crypto H&S | Not published | Not published | Not published | 4-Hour / Daily |
Figures for H&S tops and inverse H&S are Thomas Bulkowski’s published statistics, taken from his own pages on head-and-shoulders tops and head-and-shoulders bottoms. “Sees a 5% move” is 100% minus his break-even failure rate. The busted, intraday and crypto rows are marked not published because no comparable measured statistics exist for them; the numbers previously shown in those rows were not measured by anyone.
About 81% of standard H&S tops reach at least a 5% decline, and the average decline is 16%. Only 51% reach the full measured-move target, which is the number worth remembering: a confirmed pattern is more likely than not to move, and about as likely as a coin toss to go the whole way. These are equity-market statistics, where institutional distribution leaves the clearest footprint.
Inverse H&S formations do better on every published measure: an 11% break-even failure rate, so about 89% see a 5% move, a 71% rate of meeting the price target and an average rise of 45%. The likeliest reason is that the emotional exhaustion at downtrend bottoms is more extreme than the euphoria at uptrend tops. Traders who have been losing money for weeks on a downtrend are more likely to capitulate at the bottom, creating the inverse H&S geometry.
Timeframe selection matters more than any other single choice. The published statistics above are measured on daily-chart patterns in equities. Nothing comparable has been published for intraday charts, and the numbers previously shown here for 4-hour, 1-hour and 15-minute patterns were not measured by anyone. What can be said without a statistic is that intraday price action is dominated by algorithmic trading, which breaks the textbook geometry the pattern depends on.
No published statistics exist for head-and-shoulders patterns in crypto, and the figure previously shown here was invented. What can be said is structural: a 24/7 market with liquidation cascades can carry price straight through a neckline without ever offering the retest the equity-market statistics assume.
Common mistakes to avoid when trading the head and shoulders pattern
Premature entry and ignoring volume confirmation represent the most frequent errors that lead to failed head and shoulders trades.
Many traders enter short positions the moment the right shoulder completes, assuming the pattern has formed. But the pattern is not triggered until the neckline actually breaks. Premature entries get stopped out when price bounces off the neckline support and continues higher. Patience waiting for the neckline break is the difference between profitable pattern trading and stop-loss accumulation.
Messy patterns on small timeframes are unreliable. A pattern forming on a 1-hour or 15-minute chart that does not look reasonably symmetrical should be ignored. The head must be clearly higher than the shoulders, and the shoulders should be roughly equal in height. Sloppy geometry on small timeframes often represents algorithmic noise rather than institutional distribution.
Miscalculating stop-loss placement costs thousands of dollars for leveraged traders. A stop placed exactly at the right shoulder’s high (e.g., 1.0920) gets triggered by the very algorithmic wick-hunting that exploits retail stop placements. The usual practice is to place stops a short distance above the right shoulder rather than exactly on it, so that a wick through the level does not close the trade before the pattern has actually failed.
The impact of algorithmic trading on chart patterns in 2026
Modern algorithmic trading has increased the frequency of false breakouts and “stop-hunting” at the neckline of textbook head and shoulders formations.
The “Crowded Trade” effect occurs when thousands of retail traders identify the same H&S pattern at the same time. They cluster stops above the right shoulder at the same price level. Algorithmic systems detect these clusters and deliberately spike price through them to trigger liquidations, collecting the liquidity. This creates a false breakout where the neckline briefly breaks, stops are triggered, and then price reverses upward. Traders who entered prematurely or used tight stops are liquidated.
Why messy patterns are often more reliable in 2026 than textbook ones reflects this crowded trade dynamics. A pattern that doesn’t look perfectly symmetrical, where the right shoulder is slightly above the left shoulder, or the neckline is obviously sloped, is less likely to be identified by automated scanning tools. Fewer traders cluster at the standard stop levels. Fewer algorithms target the pattern. The reversal, when it comes, is more authentic.
Hybrid AI strategies increasingly use sentiment data to confirm a chart pattern breakout. Instead of just following the H&S geometry, professional traders layer in social media volume, options positioning, and market sentiment. If price is breaking the neckline AND retail traders are suddenly net short, AND options implied volatility is expanding, the pattern has higher conviction than the geometry alone suggests.
Turn Knowledge into Profit
You have done the reading, now it is time to act. The best way to learn is by doing. Open a free, no-risk demo account and practice your strategy with virtual funds today.
Open a Free Demo AccountKey Takeaways
- The head and shoulders pattern is a three-peak reversal formation that signals the transition from a bullish trend to a bearish one.
- The neckline serves as the primary support level for the pattern, and its breach is the essential trigger for executing a short trade.
- Volume confirmation is critical during the breakout; a significant spike in selling volume increases the probability of the pattern reaching its target.
- The inverse head and shoulders pattern functions identically but in reverse, signaling a bullish turnaround at the bottom of a downtrend.
- The measured move target allows traders to calculate potential profit levels by projecting the pattern’s height downward from the breakout point.
- Algorithmic stop-hunting at the neckline is a common 2026 risk, making retest entries more favorable than initial breakout entries.
Frequently Asked Questions
This article contains references to the head and shoulders pattern and Volity, a regulated CFD trading platform. This content is produced for educational purposes only and does not constitute financial advice or a recommendation to execute any specific trading strategy. Candlestick patterns and chart formations vary in reliability based on asset class, timeframe, and market conditions; always verify your broker’s trading rules and maintain adequate risk management discipline before trading. Some links in this article may be affiliate links.