Trading bearish reversals involves significant market risk and signal limitations. Evening star patterns do not guarantee reversals and require volume confirmation. Past performance is not indicative of future results. Capital at risk.
The Evening Star is a three-candle bearish reversal pattern signaling the end of an uptrend. Thomas Bulkowski’s tests put it at a bearish reversal 72% of the time, and the pattern reads best when it forms at a level the market has already defended and the third candle closes on a volume surge.
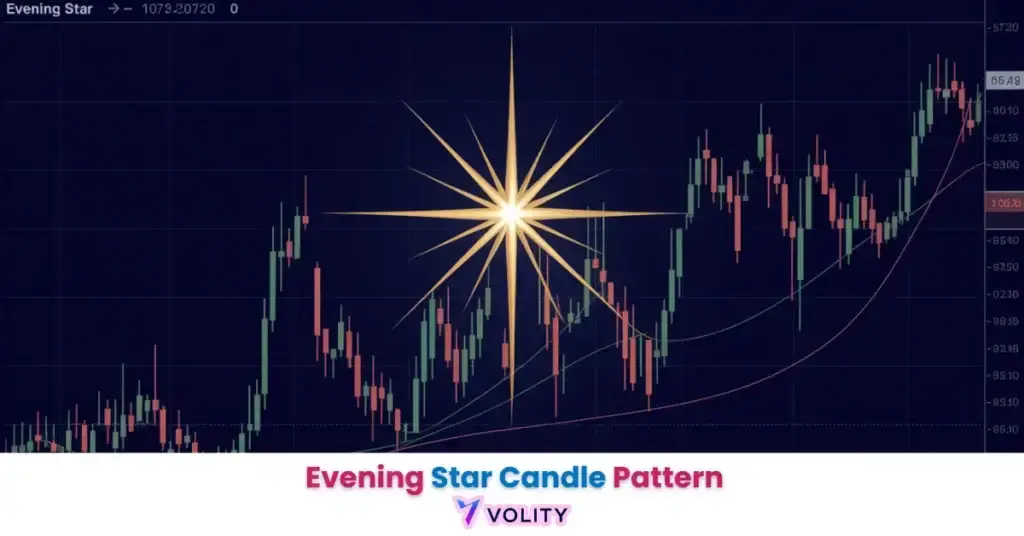
The Evening Star candlestick pattern represents a visual loss of upward momentum followed by a decisive surge in selling pressure. This formation identifies potential bearish reversals by visualizing how a small-bodied “star” candle signals market indecision before a major downward move.
Technical analysis in 2026 emphasizes the use of multi-candle patterns that filter out algorithmic noise. The Evening Star remains a cornerstone for traders seeking to identify high-probability tops and reversal zones in volatile forex and crypto markets.
While understanding Evening Star Candlestick is important, applying that knowledge is where the real growth happens. Create Your Free Forex Trading Account to practice with a free demo account and put your strategy to the test.
What is an evening star candlestick pattern?
An evening star candlestick pattern is a three-candle bearish formation that signals a potential reversal at the peak of an uptrend.
The sequence unfolds as: a large bullish candle (green/light color) that closes near its highs, followed by a small-bodied “star” candle that opens above the first candle’s close but closes with minimal net movement, followed by a large bearish candle (red/dark) that closes well into the first candle’s body. This visual progression represents “The Top”, the moment when buyers lose control to sellers. The small middle candle functions as the critical signal: by failing to make new highs despite opening above prior resistance, it reveals exhaustion of buying pressure. Doji Evening Stars are the variation where the middle candle closes as a doji, opening and closing at nearly the same price. The shape reads as maximum indecision, though Bulkowski’s tests give it no reliability advantage over the standard evening star and rank it considerably lower for overall performance.
The trend reversal signals in Forex guide explains how multiple candlestick patterns combine to confirm trend exhaustion and identify high-probability short entries.
Ready to Elevate Your Trading?
You have the information. Now, get the platform. Join thousands of successful traders who use Volity for its powerful tools, fast execution, and dedicated support.
Create Your Account in Under 3 MinutesHow to identify the evening star formation accurately
The bullish counterpart is the morning star candlestick; for the broader candlestick framework, see how to read candlestick charts and doji candlesticks.
Accurate identification of the evening star pattern requires recognizing the specific open-to-close relationships of three consecutive candlesticks.
The first candle must show strong bullish momentum with a close significantly above the open. The second candle (the “star”) reverses, it opens above the first candle’s close but closes lower, creating the characteristic small body. The critical distinction separates valid evening stars from common pullbacks: the star candle must demonstrate indecision (small body) while simultaneously failing to establish new highs. The third candle closes well into the first candle’s body, ideally closing below the midpoint. This three-part structure becomes essential for filtering false signals: a single large red candle after a white candle lacks the confirmation that the star’s indecision provides. Volume analysis enhances identification accuracy: a volume surge on the third candle suggests institutional selling rather than algorithmic noise.
How reliable is the evening star pattern in 2026?
Evening star pattern reliability in 2026 depends significantly on timeframe selection, resistance level proximity, and volume confirmation.
Thomas Bulkowski’s testing in the Encyclopedia of Candlestick Charts finds the evening star acts as a bearish reversal 72% of the time, with an overall performance rank of 4 out of 103 candlestick patterns. Two qualifications come with that number. It is a rare pattern, ranked 71st for frequency, so you will not see many of them. And most of the measured performance comes from upward breakouts rather than downward ones, so a downward breakout in a bull market is the version to avoid. Lower timeframes are noisier still: the shorter the bar, the more often the shape appears without the exhaustion it is supposed to represent. The formation at resistance levels is what does the work: an evening star at an arbitrary price lacks the predictive power of one forming exactly where the market has already turned. A volume surge on the third candle is the confirmation to wait for, because it separates conviction selling from a quiet drift lower.
How to trade an evening star pattern effectively
Trading an evening star pattern effectively requires aligning the signal with resistance levels, volume confirmation, and risk management discipline.
Entry strategies involve waiting for the close of the third candle rather than entering prematurely, this confirmation reduces whipsaw risk where the pattern fails to complete. Stop-loss placement should extend above the star candle’s high, protecting against reversals where the pattern fails and uptrend resumes. Take-profit targets can use Fibonacci retracements of the prior uptrend or mechanical 2:1 risk-to-reward ratios. Position sizing matters more for reversals than trend-following trades: risk only 1% of account equity per evening star trade because false signals occur frequently without proper contextual filtering.
Turn Knowledge into Profit
You have done the reading, now it is time to act. The best way to learn is by doing. Open a free, no-risk demo account and practice your strategy with virtual funds today.
Open a Free Demo AccountEvening Star vs. Morning Star: Understanding Directional Variations
The evening star identifies bearish reversals while the morning star identifies bullish reversals at opposite points in the market cycle.
Both patterns follow three-candle structures with a small middle candle representing indecision. The directional difference determines trading direction: an evening star forms after an uptrend (use for shorts), while a morning star forms after a downtrend (use for longs). The psychology remains consistent, small middle candles signal trend exhaustion, but market positioning differs entirely. Learning both patterns allows traders to recognize reversal opportunities in either direction while understanding that the pattern structure itself (three specific candles) determines directional bias.
Why evening star patterns fail
Evening star patterns fail most frequently when they form within low-volume consolidation ranges or without trending context.
Range noise is the primary failure mechanism: false “evening stars” form during sideways oscillation, where the shape appears mechanically without the reversal psychology behind it. Bulkowski’s identification guidelines are explicit that the price trend leading into the pattern must be upward, so a pattern without a clear prior uptrend is not an evening star at all, whatever it looks like. Volume deficiency indicates algorithmic trading rather than institutional participation: a low-volume evening star on the third candle suggests algorithmic fill trading rather than conviction-driven selling. Professional traders implement strict filters: only trade evening stars at major resistance levels with volume confirmation on the third candle and within established uptrends.
Key Takeaways
- Evening star patterns identify three-candle bearish reversals signaling potential tops at the end of uptrends.
- Bulkowski’s tested result is a bearish reversal 72% of the time, with the pattern reading best at levels the market has already defended.
- Volume confirmation on the third candle is what separates conviction selling from a quiet drift lower.
- The small-bodied middle candle (the star) represents the critical indecision that signals buying exhaustion.
- Stop-loss placement should extend above the star candle’s high to protect against failed reversals.
- Evening star patterns fail in low-volume ranges; traders must require clear uptrend context and institutional volume participation.
Frequently Asked Questions
This article contains references to evening star candlestick patterns, technical analysis, and Volity, a regulated CFD trading platform. This content is produced for educational purposes only and does not constitute financial advice or a recommendation to buy or sell any financial instrument. Always verify current regulatory status and platform details before using any trading service. Some links in this article may be affiliate links.
What our analysts watch: Three context filters that separate a tradable evening star from chart-pattern noise. Trend context (the pattern is a reversal signal, not a continuation signal; an evening star inside a sideways range is the wrong pattern in the wrong place, and every published reliability figure assumes the established prior uptrend that the pattern definition requires). Gap quality on candle two (a true evening star gaps up on the open of the second candle; spot FX rarely produces gaps so the FX equivalent is a clean opening above the prior close on the timeframe being read). Confirmation close on candle three (a close that penetrates more than 50 percent into the body of candle one is the conventional threshold for separating the higher-quality occurrences from the marginal ones).
Related guides
Volity operates a trading platform and also publishes educational and analytical content about trading. The content on this page is for educational purposes only and should not be considered financial advice. Volity may benefit commercially when readers open trading accounts through links on this site.
Our content is produced and reviewed under documented editorial standards; comparison and review methodology is published here.